
Grouped, not dumped
Sales, leads, quotes, jobs, profitability, labour, contacts and financial. Each category holds the reports that actually belong to it.
Reports and AI assistant
Revenue, conversion, throughput, margin, utilisation and cash — grouped into eight categories, saved when you want them again, and answerable in plain words.
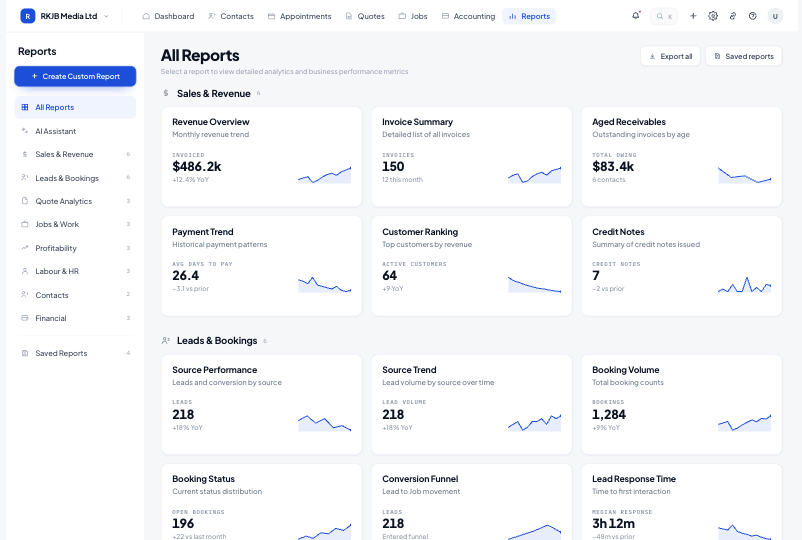
Sales, leads, quotes, jobs, profitability, labour, contacts and financial. Each category holds the reports that actually belong to it.
"Which lead sources converted best this quarter?" — the assistant builds the answer from your data and shows the working.
Saved reports carry who ran them and when, in mono, so a number in a meeting can be traced back.
Revenue overview, quote conversion, job margin, labour recovery, utilisation, aged receivables, GST return — the reports a trade business is actually asked for, ready to run.
Type the question the way you would ask the bookkeeper. The assistant picks the data, builds the view and leaves it as a report you can save.
The dashboard is a widget board you arrange yourself: pick tiles from the catalogue, size them, and save the layout for the whole workspace.
Custom reports let you pick the data, the grouping and the period, then save the result alongside the built-in ones.
Only your workspace's own data. It reads the same records the reports read, and shows which ones it used to build an answer.
Any report can be exported for a spreadsheet or attached to an email, and saved reports keep the run date and the person who ran it.
Each workspace reports on its own company. The workspace switcher moves between them without mixing the numbers.
Start free for 14 days. Bring one live job across and see what it actually made.