
A busy month can hide a lot. Plenty of quotes sent, plenty of people on site, plenty of invoices raised. None of that tells you whether the work is converting, the hours are being recovered, or the jobs are making the margin you expected.
Those are different questions. They deserve reports built to answer them.
The new Systemise platform, releasing soon, has a catalogue of 50 standard reports across eight areas of the business, alongside Report Studio for the questions specific to yours. This article describes that upcoming platform.
The number gives you an idea of the coverage. The useful part is what you can find out, what records each report uses, and whether you can get back to the same question next month.
Start with the question
If fewer quotes are turning into work, start with Quote Conversion. If the work is being won but the office is chasing decisions, look at Follow Up Ageing and Quote Pipeline. If the crew is busy but the return looks thin, look at Job Margin, Labour Recovery and Cost Breakdown together.
A report should help you decide what to examine next. Sometimes that is an overdue follow-up. Sometimes it is a job category that keeps consuming more labour than expected. Sometimes it is a gap in the records.
That last answer matters just as much. A reassuring figure built from missing costs is still the wrong figure.
The standard reports, named
The upcoming platform's catalogue is organised into eight categories. These are the report names you will find there.
Sales & Revenue
Revenue Overview, Invoice Summary, Aged Receivables, Payment Trend, Customer Ranking and Credit Notes.
This is the invoicing and customer-revenue view: what has been billed, who it came from, what remains outstanding, and how payments behave where payment records are available. Revenue raised and cash received are different things; choose the report that answers the question you mean.
Leads & Bookings
Source Performance, Source Trend, Booking Volume, Booking Status, Conversion Funnel and Lead Response Time.
These reports help you follow incoming work: where it comes from, how the volume changes, what happens to bookings and how enquiries progress. They give you somewhere to start when you need to distinguish fewer opportunities from weaker conversion.
Quote Analytics
Quote Conversion, Quote Value Bands, Follow Up Ageing, Quote Performance, Quote Pipeline and Employee Performance.
These cover the work you are trying to win. You can examine acceptance, the value of work being quoted and won, open quotes awaiting a decision, and outcomes by salesperson. Quote Conversion and Quote Performance answer different questions, so read the basis of the rate before comparing them.
Jobs & Work
Job Throughput, Schedule Adherence, Category Volume, Job Status, Active Jobs and Duration Analysis.
These look at delivery: completed work, the open workload, the mix of job categories, planned dates against completion, and allowed hours against hours worked. The comparisons depend on recording the dates and allowances they need.
Profitability
Job Margin, Labour Recovery, Materials Variance, Category Margin, Cost Breakdown and Profit Trend.
These bring recorded value and cost together. Job Margin compares job value with recorded costs; Category Margin lets you examine the same question by work type. Materials Variance compares quoted material costs with the material costs recorded against the job. Labour Recovery and Cost Breakdown help you see what sits behind the result.
Labour & HR
Timesheet Summary, Utilisation, Labour Cost, Labour Revenue, Hours by Category and Timesheet Compliance.
These cover recorded hours, booked capacity, pay and charge-out values, and missing timesheet entries. They are useful both for reviewing work and for spotting records that need attention before you rely on the totals.
Contacts
Contact Growth, Interaction Coverage, Customer Overview, Lifetime Value, Type Analysis, Geo Distribution and Repeat Business.
These help you understand the customer base: who is buying, who comes back, where the work is, and which relationships have gone quiet. Lifetime Value looks at recorded revenue accumulated by customer; it is not a prediction of what a customer will spend in future.
Financial
Cash Position, GST Return, Chart of Accounts Activity, P&L Summary, Purchase Summary, Revenue vs Costs and Outstanding Balances.
These bring together the financial records held in Systemise. Banking and account activity need bank records and ledger postings to report on. The GST Return report currently estimates purchase GST from recorded purchase information and the company's GST rate, so its figures need checking rather than treating the screen as a completed return.
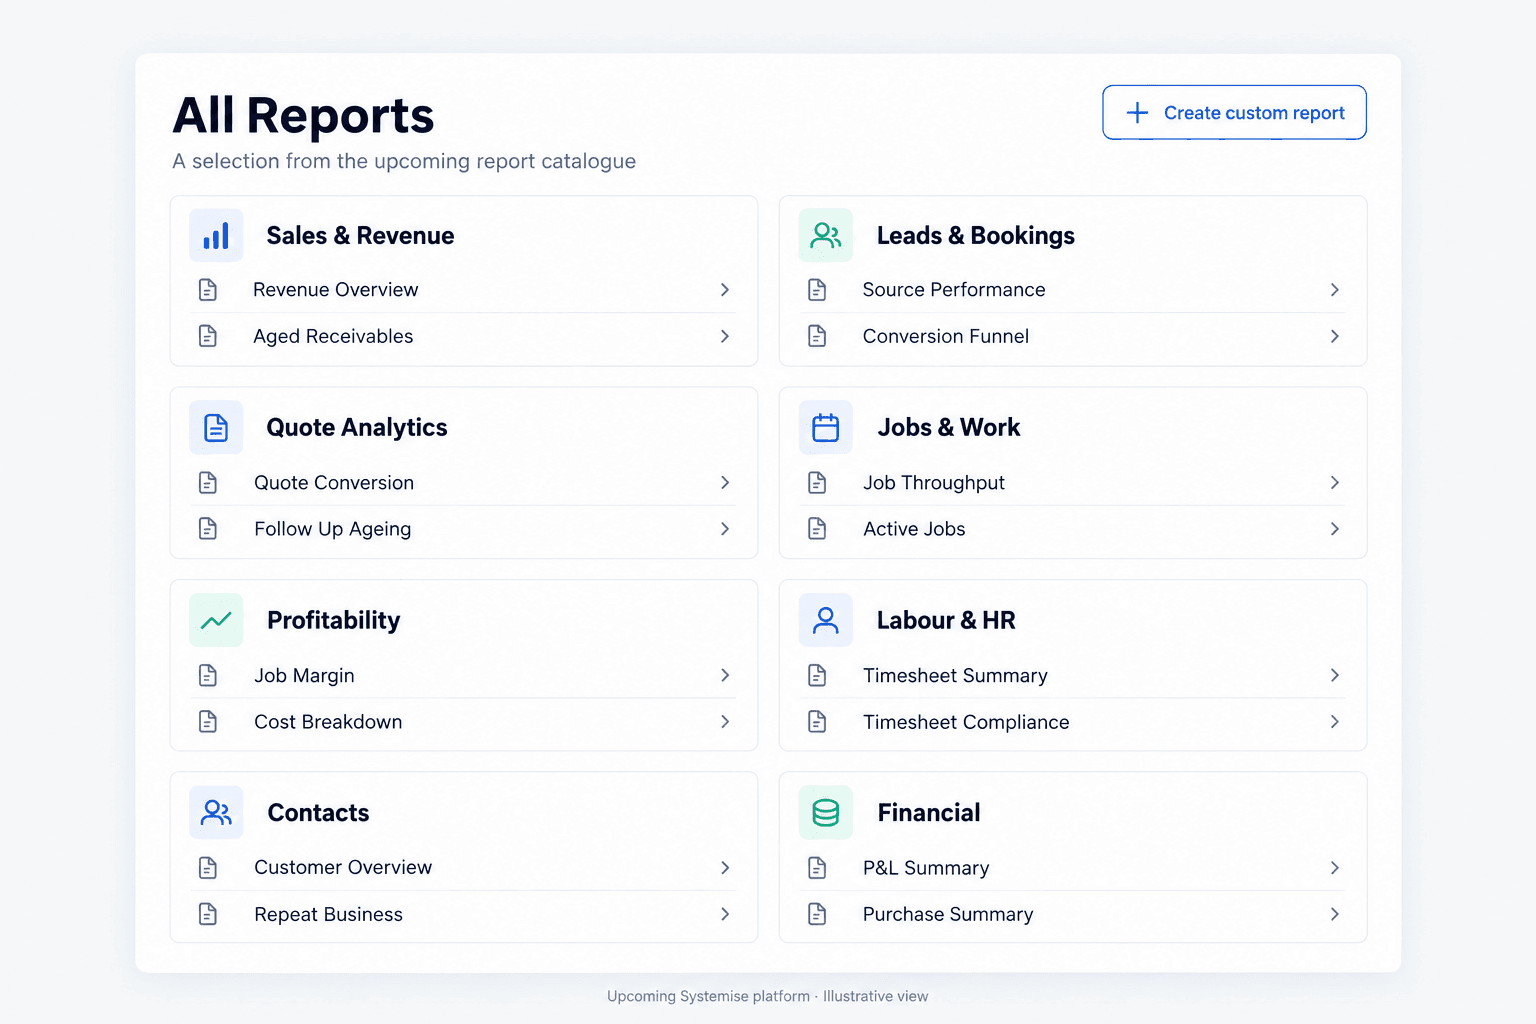
A selection from the upcoming platform’s eight report categories. Illustrative view; available results depend on the records held.
Read the result and its basis
The standard report pages bring together headline figures, charts, breakdowns and detail tables. You can change the reporting period, switch chart data to a table, and export report data as CSV or PDF. Where a report offers a drill-down, you can inspect the records behind a figure.
The pages also explain what the report reads. That helps you distinguish, for example, invoiced revenue from receipts, or a quoted allowance from actual hours.
For a monthly review, pick a small set that matches the decisions you make. Quote Conversion, Follow Up Ageing, Active Jobs, Job Margin and Timesheet Compliance might be a useful starting point. The whole catalogue is there when you need to investigate; it does not have to become fifty things to check every Monday.
The reports you build yourself
Standard reports cover recurring questions. Your business will still have questions that need a particular combination of fields, filters and groupings.
Report Studio lets you choose a source, select columns and related data, filter the records, group and summarise them, and set the order of the result. A live preview shows what those choices produce as you build.
You can then save the report, return to it, export it, and choose whether to put it on the dashboard. A report you use every month should not require the same construction work every month.
There is also an Ask AI option in the studio. Describe what you want to see and the assistant can draft a report using the data available to the builder. It checks which fields contain information and offers a proposal for you to review and edit. Saving the report remains your action.
That makes a request such as “list quotes still at follow-up, biggest first” a starting point you can inspect, rather than an answer you have to take on trust.
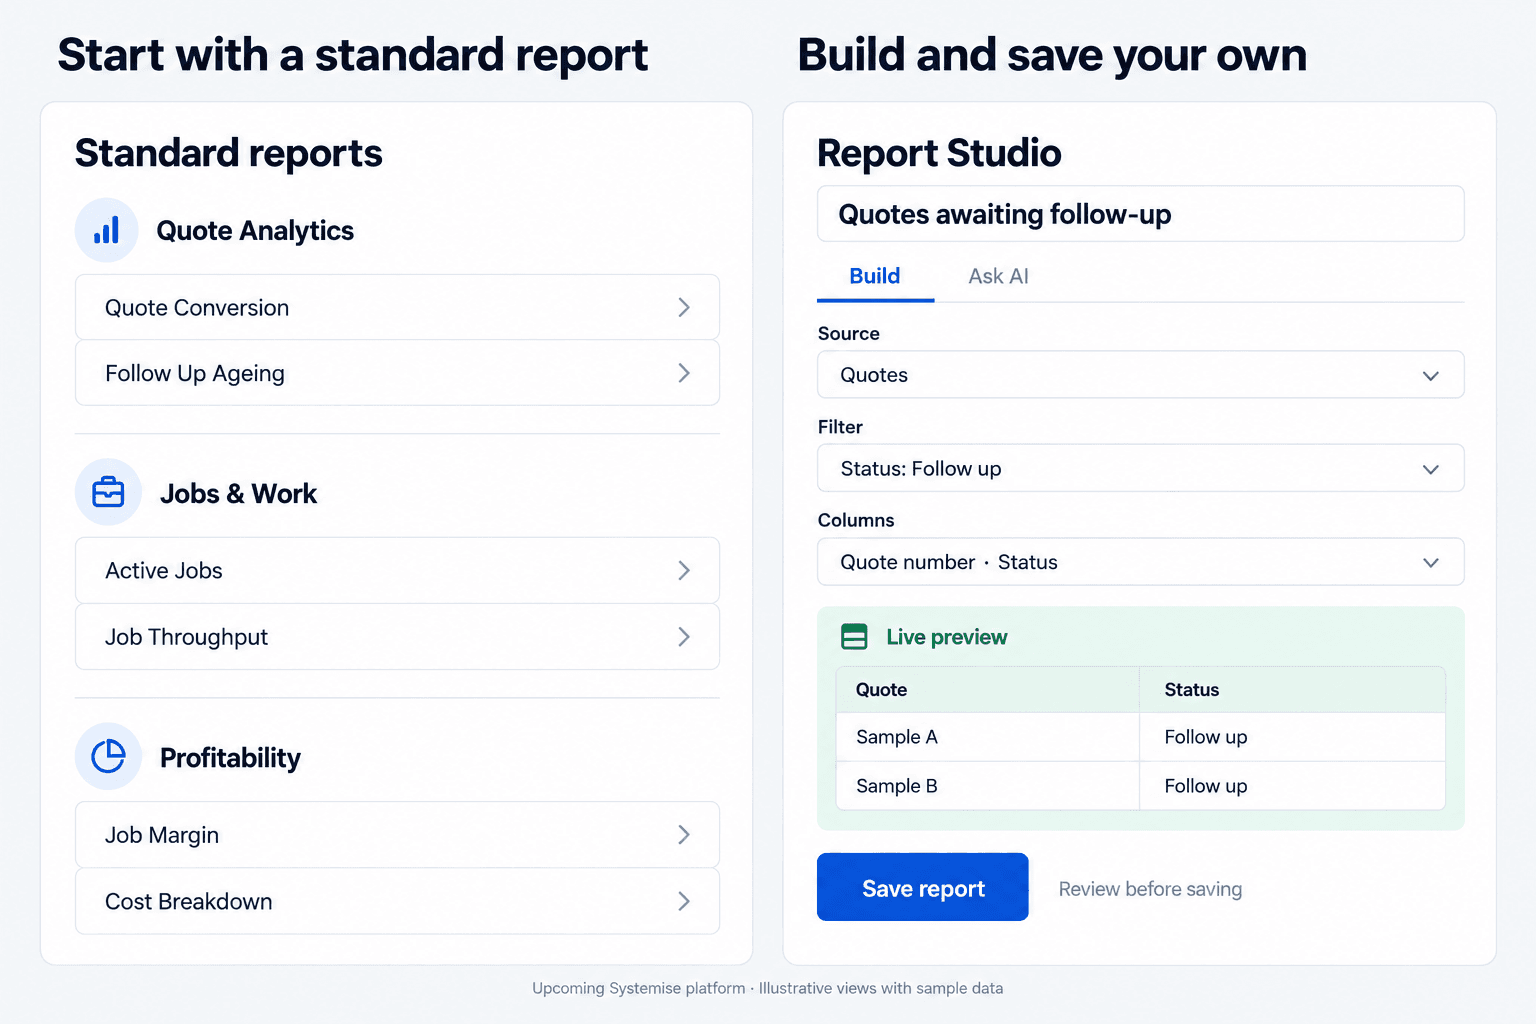
Start with a standard report or build, preview and save your own. Illustrative views of the upcoming platform with sample data.
Decide who should have report access
Reports can bring customer information, labour costs and financial detail together in one place. Give reporting access deliberately, and review the audience when saving or sharing a custom report.
As part of setup, check what each role can open and export using a representative account. Include reporting in that review, alongside the job and accounting screens.
What to ask when you evaluate reporting
Which report answers the question I ask every week? Start with a real example from your business and follow it through to the underlying records.
What does the figure include? Check the date basis, status, costs and source records. Similar labels do not always mean the same calculation.
Can I save a question specific to my business? Build it, inspect the result, save it and come back to it.
What happens when information is missing? An explanation of missing source data is more useful than a confident-looking empty chart.
Who can see and export the result? Check reporting access as part of your permission setup.
Where to look next
The reporting area is covered on Reports and AI assistant. The articles on recording labour and capturing receipts explain two of the habits that make the results more useful.
The upcoming platform offers a much broader reporting catalogue than the legacy application. The reason to use it is still practical: find the question that matters, understand the records behind the answer, and make it easy to ask again.